Ireland is Curtailing Wind While Importing Power from Britain
A look at what interconnector flows actually show since 2023

The views expressed here are solely my own and do not represent those of my employer.
Something strange is happening in the Single Electricity Market (SEM) - the power market on the island of Ireland.
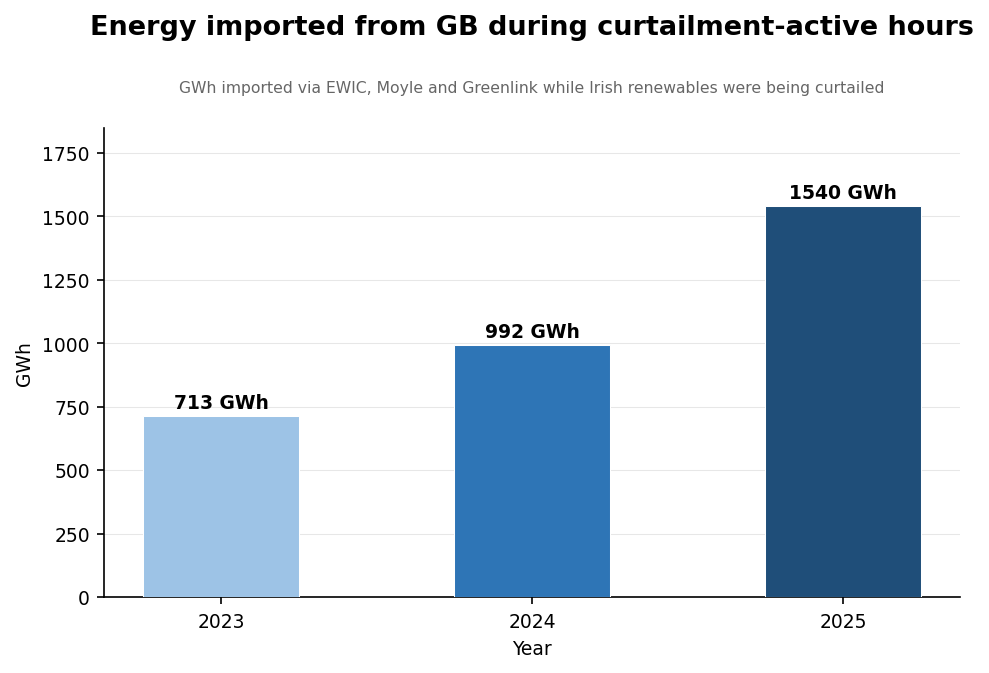
In 2025, during the hours when Ireland was curtailing its own wind and solar generation, it imported 1,540 GWh of electricity from Great Britain (GB). That figure has more than doubled in two years, and shows no sign of reversing. To be clear, curtailment here does not include dispatch down due to constraints.
Interconnector Misconceptions
There’s a widely held belief in Irish energy discourse that electricity interconnectors function as escape valves for excess wind generation, and by extension, reduce curtailment. While interconnectors can and do serve this function, that isn’t always the case.
In practice, interconnectors are fundamentally vehicles for price arbitrage between electricity markets. Import and export flows are primarily determined by the price differentials between connected markets, in this case between the SEM and GB. They carry out this function very effectively and bring real market benefits. But that’s a different thing from being a guaranteed outlet for surplus renewable energy generation.
This oversimplification of how interconnectors operate in complex electricity markets is widespread. There is no shortage of EU documents stating the benefits of proposed interconnector projects when it comes to reducing renewable energy curtailment.
For example, the European Commission website states that the Celtic Interconnector:
will allow Ireland to export surplus renewable (wind and solar) energy to France during times of excess generation.
The EU Project of Mutual Interest (PMI) documentation for the proposed 750 MW MaresConnect interconnector linking Dublin to the north of Wales states that:
The project will contribute to climate change mitigation by bringing additional sustainability benefits, in particular by reducing curtailment of renewable energy.
But the question is:
Are electricity interconnectors actually reducing renewable energy curtailment in Ireland?
Where this started
The motivation to run this analysis came from a paper I read recently entitled ‘Analysis of Wind Energy Curtailment in the Ireland and Northern Ireland Power Systems’ published in 2023 by Hurtado et al.
One pair of somewhat mundane looking graphs in the paper caught my attention in particular.
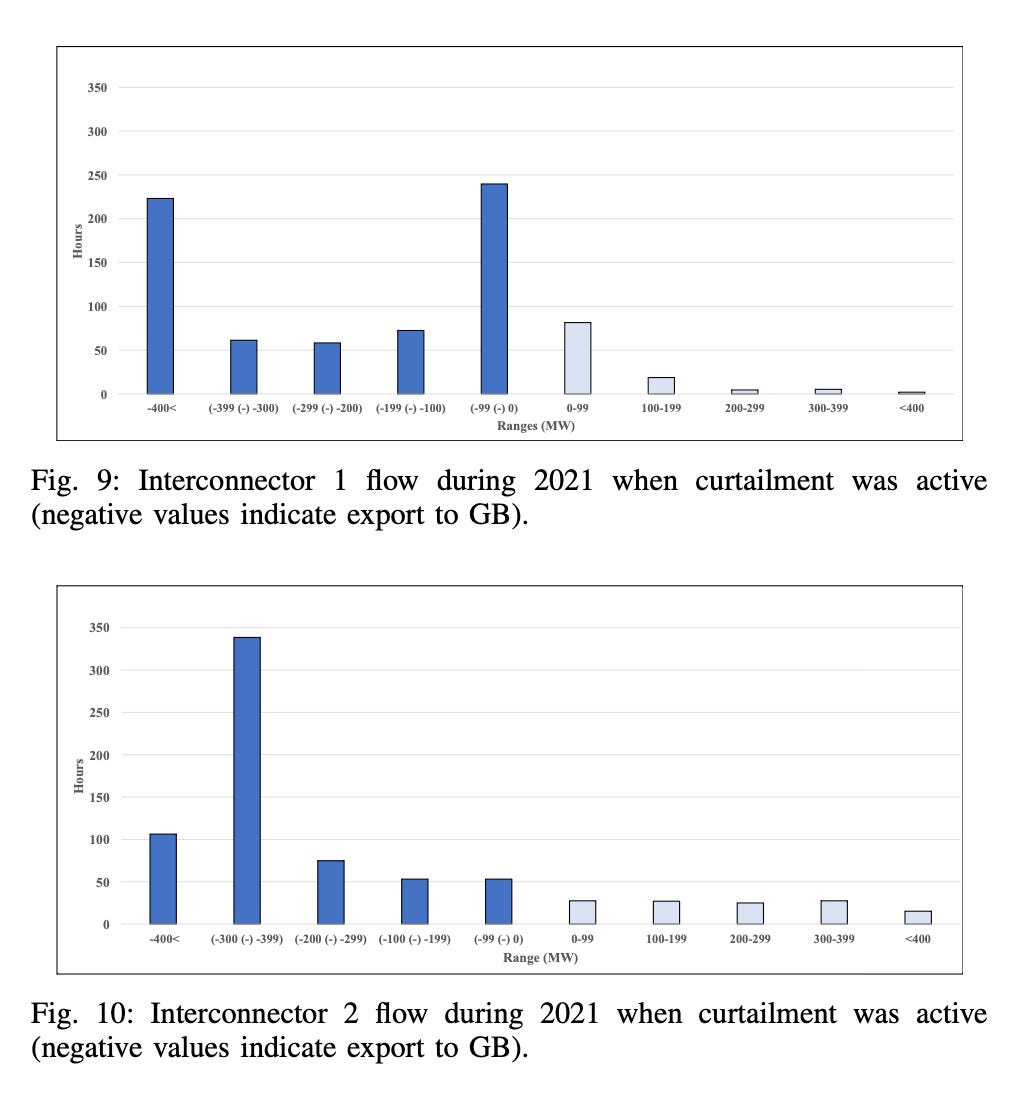
The charts show the interconnector flows for Moyle and EWIC (IC-1 and IC-2) during the hours in 2021 when wind curtailment was active in the SEM. Positive MW values indicate imports from GB to Ireland; negative values indicate exports from Ireland to GB.
Figure 9 shows that around 85% of the time IC-1 was exporting electricity to GB when curtailment was occurring in the SEM in 2021. IC-2 shows a similar story, exporting 82% of the time while curtailment was active. Imperfect, but broadly consistent with the escape-valve narrative.
Towards the very end of the paper, the authors pay fleeting attention to this imperfection in the data:
As happened with IC-1, at times IC-2 also appears to import energy from GB while wind is being curtailed. Ideally, the latter situations are not desirable from a wind curtailment point of view.
This last line in particular is what sparked my curiosity. So I set about recreating these interconnector flow bar charts with more up to date data (including both wind and solar curtailment)1. I wanted to see if what was once just an anomaly in data had morphed into something more significant. Especially after hearing grumblings from friends in energy trading that Ireland was increasingly importing power from GB and curtailing indigenous wind generation at the same time.
After crunching the numbers, I was pretty surprised. Things have changed a lot since 2021.
What the recent data shows
The graphs below are my attempt to replicate the charts in the paper. I could only get my hands on a complete dataset from 2023 up to the end of April 2026. Instead of plotting just a single year on each bar chart as was done in the paper, I decided to condense each of the four years into a stacked bar chart for each interconnector.
Immediately you can see that things have changed significantly. Looking at the distribution of interconnector flows during curtailment active hours across EWIC, Moyle and Greenlink, the picture has flipped. The stacked bar charts are now biased to the right, rather than to the left. The import bins now dominate in each chart.
East-West Interconnector (EWIC)
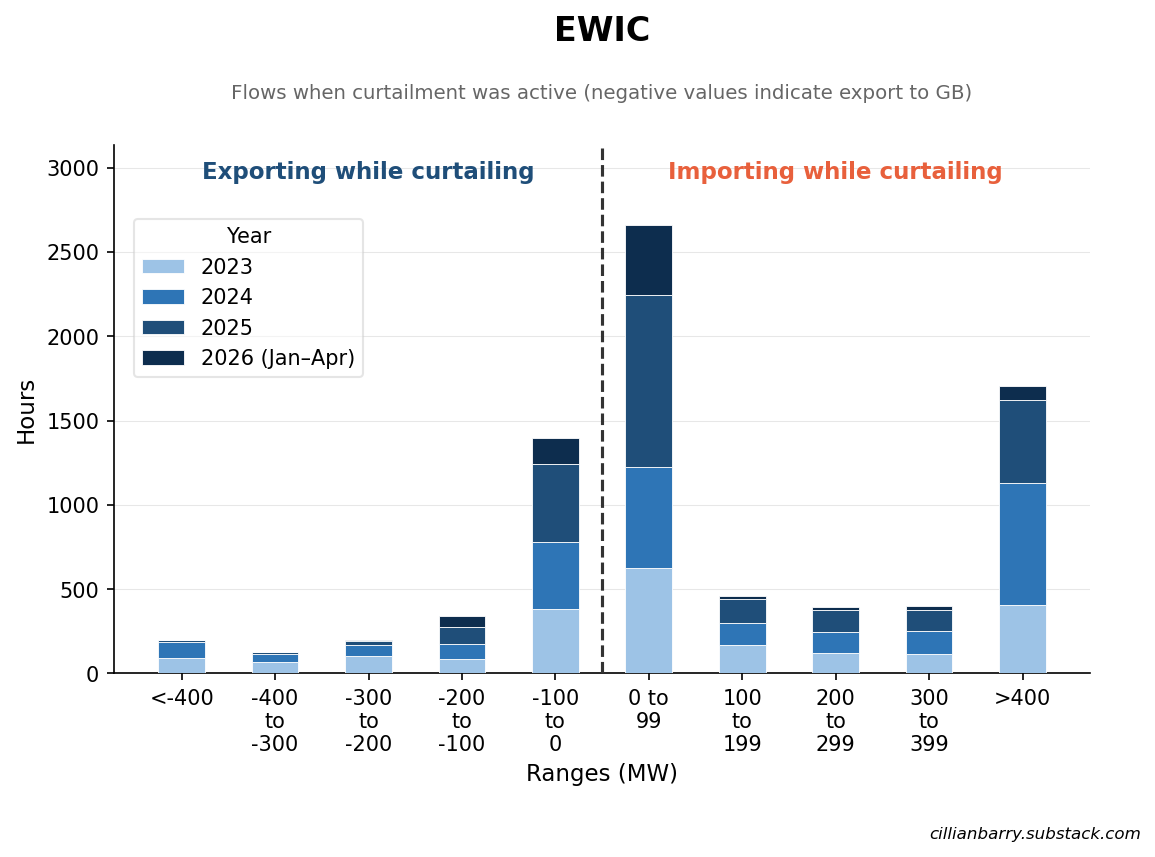
During curtailment-active hours over the 2023-2026 period, EWIC was importing from GB 71.3% of the time and exporting to GB 28.3% of the time. As you can see in the chart, for EWIC, the majority of these flows fall in the 0 to 99 MW import bin.
Moyle Interconnector (NI to Scotland)
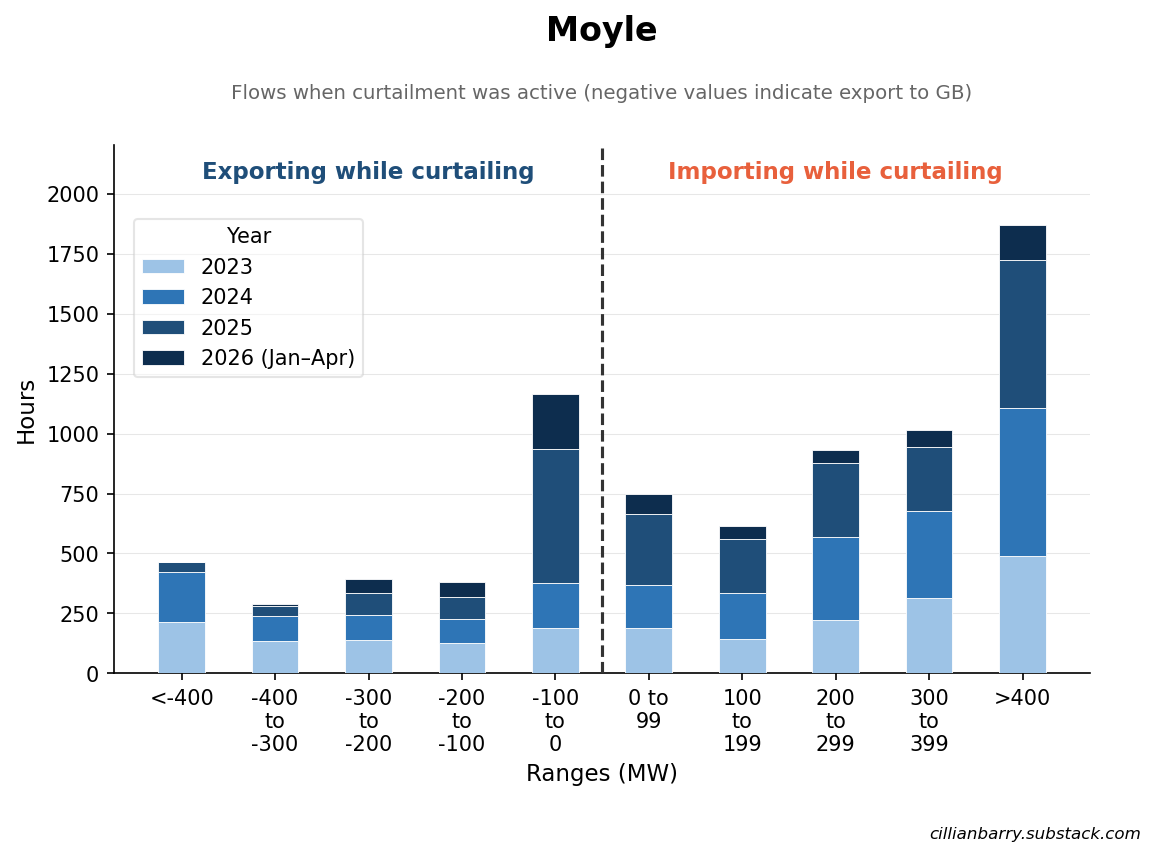
During curtailment-active hours over the 2023-2026 period, Moyle was importing from GB 65.8% of the time and exporting to GB 33.5% of the time. For Moyle, the most common bin is the >400 MW import bin.
The Greenlink Interconnector (IRE-Wales)
Greenlink came online in January 2025. It immediately jumped to the top of the interconnector dispatch hierarchy, becoming the most utilised of the three cables due to lower transmission losses. As a result, it also became the most aggressive importer of the three links during periods of curtailment.
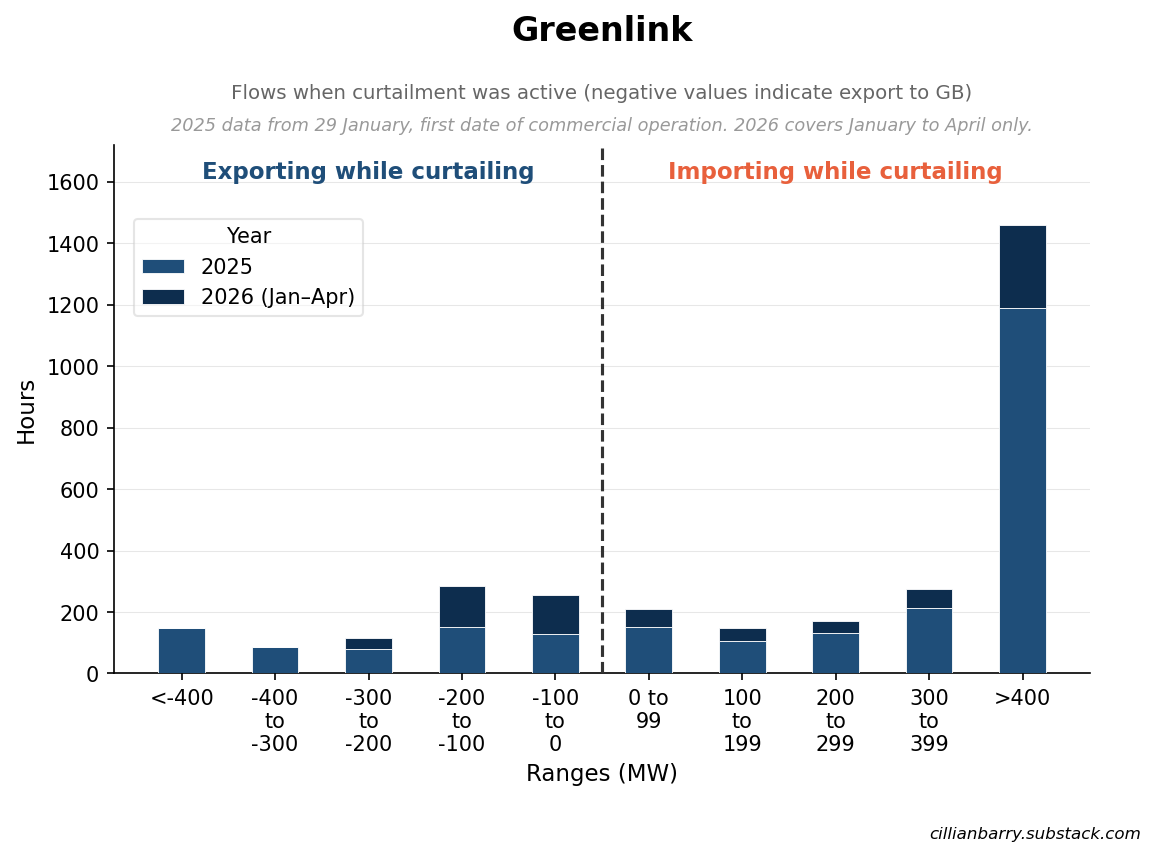
During curtailment-active hours from 29th Jan 2025–Apr 2026, Greenlink was importing from GB 71.8% of the time and exporting to GB 28.2% of the time.
Some of the most illuminating data can be found by looking at the most recent interconnector flows this calendar year. In fact, to date in 2026 exports have failed to exceed ~700 MW during periods when curtailment is occurring in the SEM. There are simply no data points on the far left-hand side of the scatter diagram below. For some reason, there have been no instances when all three interconnectors are exporting anywhere near their full cumulative capacity during curtailment active periods.
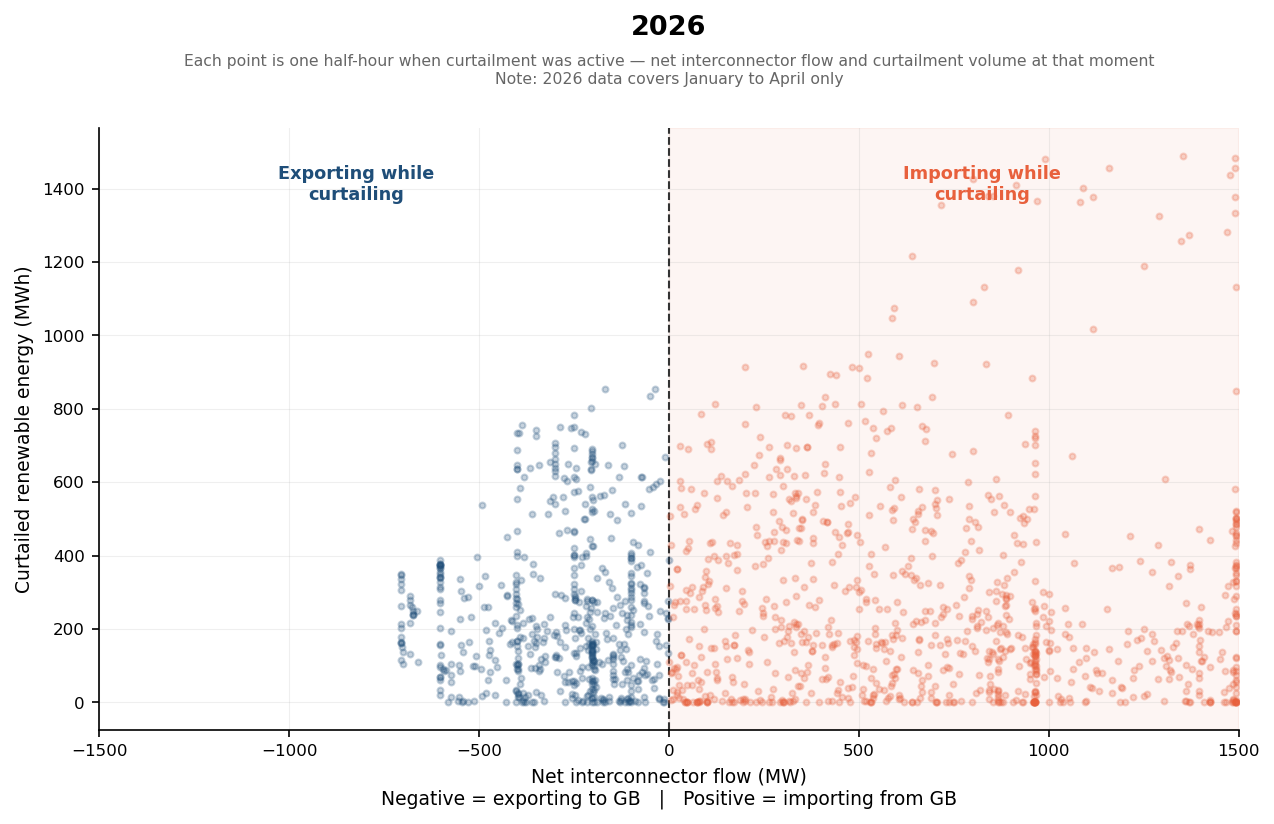
This is despite some pretty decent wind and solar conditions in the first four months of the year, with almost 50% of electricity generated by renewables in April. The month of April also set a solar record, with grid-scale solar exceeding 1 GW for the first time.
Specific Causes of Curtailment
In the SEM, curtailments are assigned a specific reason code, namely:
High Frequency/Minimum Generation: Used when attempting to alleviate an emergency high frequency event or in order to facilitate the minimum level of conventional generation on the system to satisfy reserve requirements.
SNSP Issue: Used to reduce the System Non-Synchronous Penetration.
ROCOF/Inertia: Used when the Rate of Change of Frequency (ROCOF) value for the loss of the largest single infeed is unacceptably high and wind must be dispatched down as a result or when the system inertia is too low.
Curtailment predominantly splits into High Freq/Min Gen and SNSP-driven issues. Interestingly, over the past three years, the share of curtailed energy due to SNSP issues has risen sharply, from single digits in 2023 to nearly 40% in the first four months of 2026.
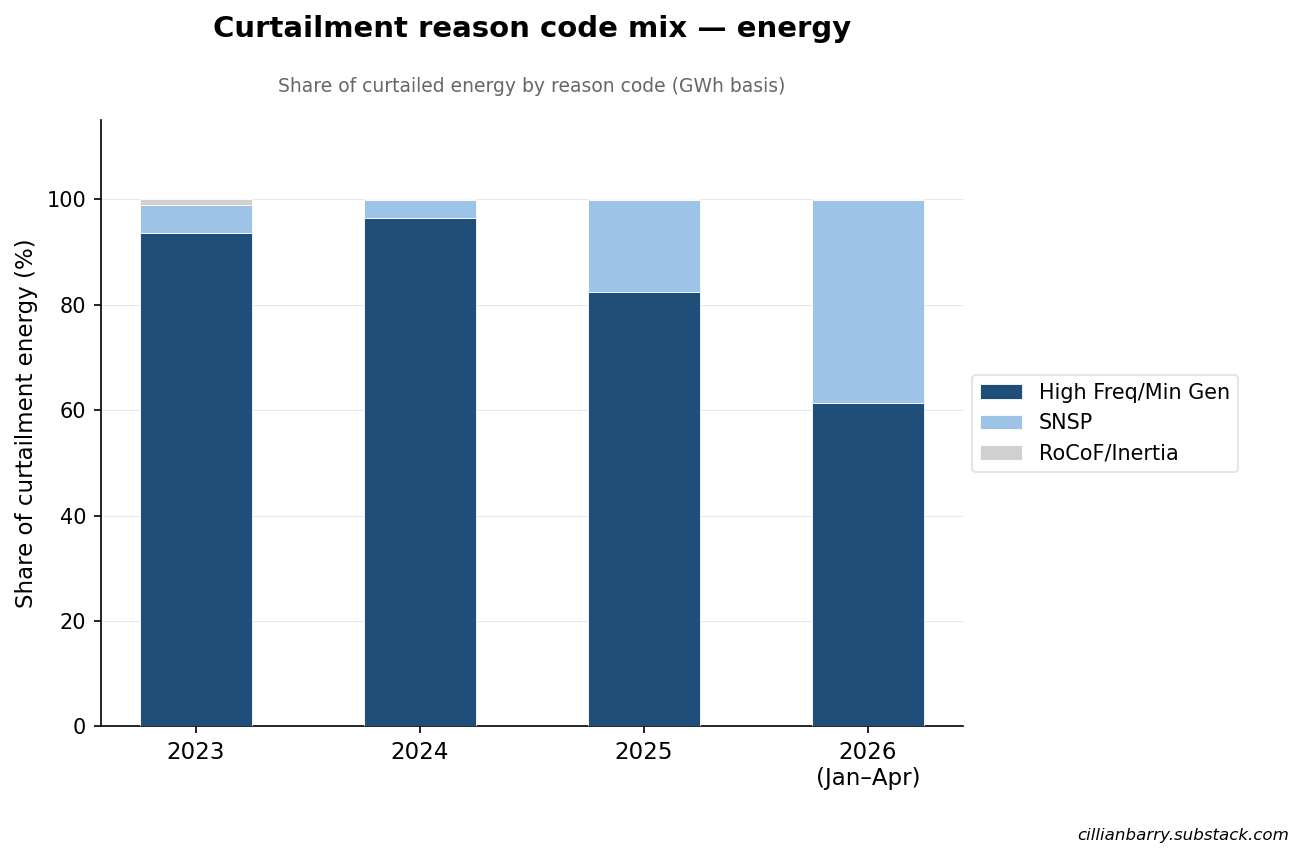
Across 2023 and 2024, curtailments driven by the SNSP constraint were rare and small in magnitude. However, following the commissioning of Greenlink, the occurrence of curtailments driven by the SNSP constraint increased in both frequency and magnitude. While correlation does not mean causation, this is certainly cause for concern. This can be seen graphically in the chart below.
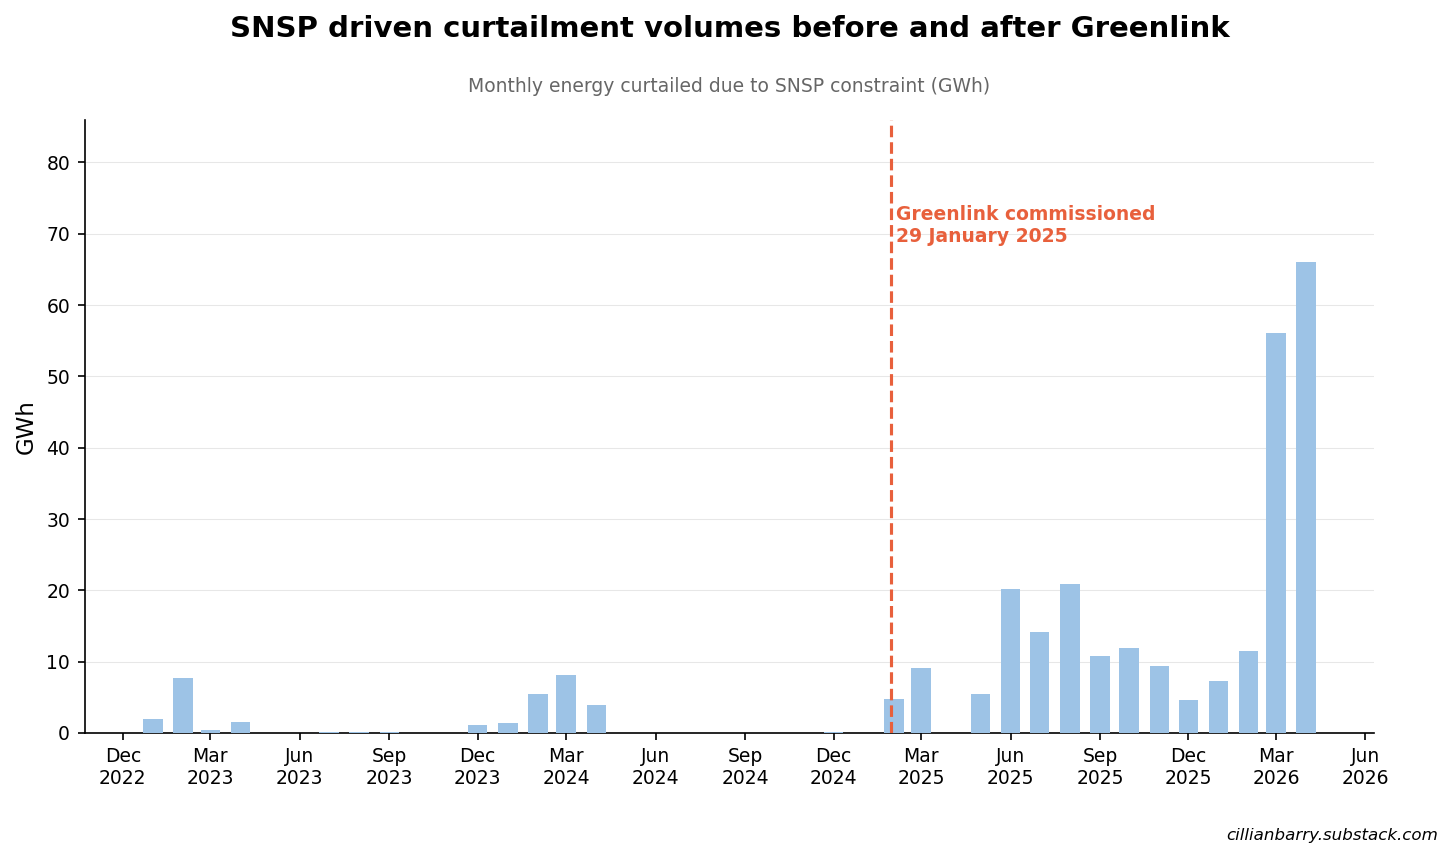
The mechanism to explain this trend is actually quite intuitive if we look at the SNSP calculation formula. Interconnector imports sit in the numerator. Importing power over an interconnector during a period of curtailment therefore increases the measured SNSP (%), pushing the system closer to, or past, the current 75% SNSP limit.

The SNSP calculation formula was updated in September 2025 to include BESS charging and discharging, which is a promising development.
Why is this happening?
To be honest, fully explaining the drivers of these market dynamics is a bit above my pay grade. I’m not entirely sure what is driving these dramatic changes in the market since 2021. However, I have a few hypotheses I will explore here.
Implicit Allocation: Intraday 1 and Intraday 2 Auctions
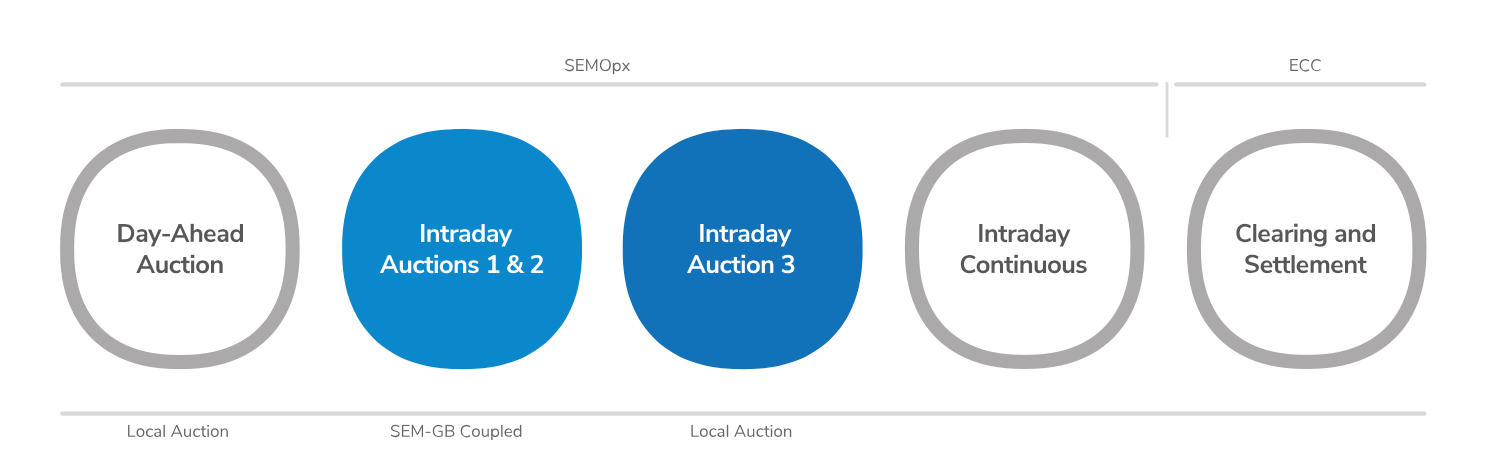
The first relates to the specific power market auctions in which the SEM-GB interconnectors are coupled. Interconnector capacity between Britain and Ireland is allocated via coupled, simultaneous intraday auctions run by EPEX in Britain and SEMOpx in Ireland.
SEMOpx operate the day-ahead and intraday electricity markets in the SEM. The day-ahead market (DAM) is a daily auction which closes the day before energy is delivered. The DAM is, by far, the largest market in the SEM, with ~80% of all volumes cleared there.
The intraday market is closer to real time, with three auctions every day (see diagram below). For the first Intraday Auction (IDA-1) and second Intraday Auction (IDA-2) the SEM is coupled with the GB bidding area via Moyle, EWIC, and the Greenlink interconnectors. The third Intraday Auction (IDA-3) is a local SEM auction and is not coupled with the GB bidding area.
For some reason that I don’t fully understand, the SEM/GB IDA-1 price spread very rarely favours export from the SEM to GB (at least lately). Even in months with high levels of wind generation in the SEM, there are very few intervals where the price in the SEM intraday market falls below that of the intraday market in GB.
The charts below published by the SEM Committee in their monthly energy market monitoring reports show the interconnector flows vs the SEM/GB IDA-1 price spread in each trading interval in January 2026.
To interpret these scatter diagrams, you can think of them simply as having four separate quadrants. In the top right quadrant, prices in the SEM are higher than GB, and as a result, power is flowing from GB to the island of Ireland. Any values falling in the bottom left quadrant represent a period when prices in the SEM are lower than in GB, and power is flowing from the island of Ireland to GB.
Interconnector flows vs SEM/GB IDA1 price spread in January 2026
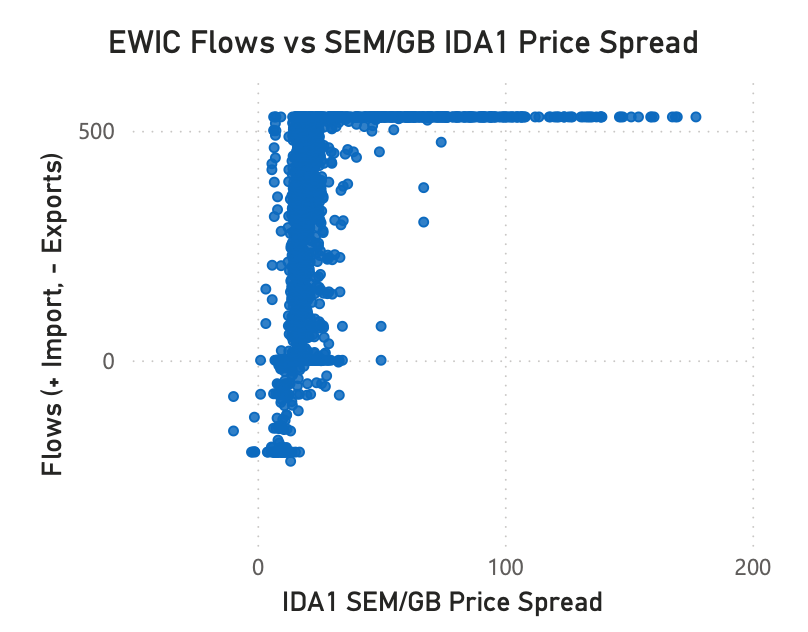
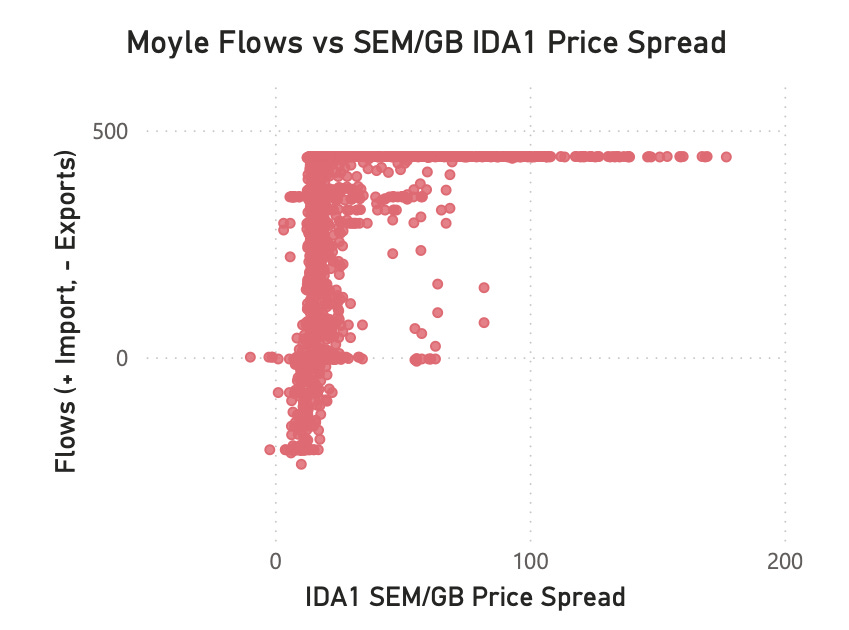
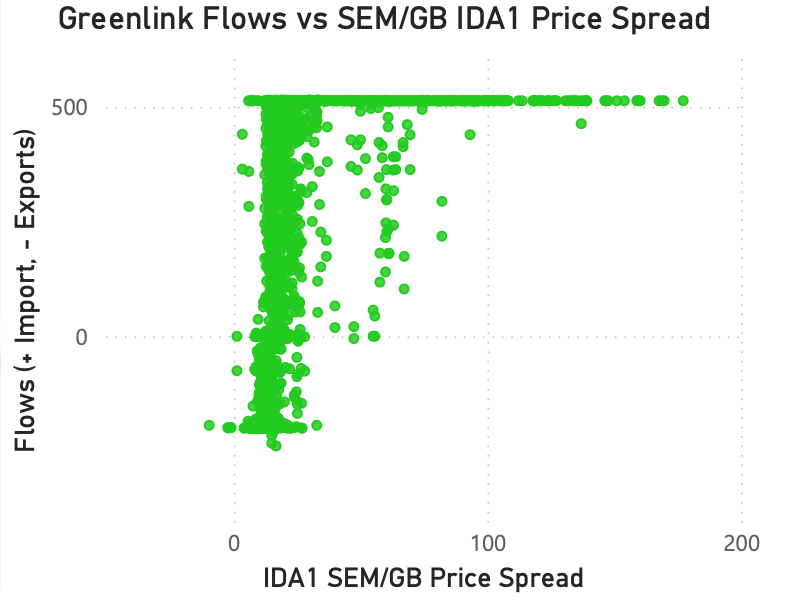
A few obvious trends emerge. Firstly, it’s clear that price spreads jump dramatically once the interconnector import capacity is maxed out. This is indicated by the horizontal ceiling of data points pinned at the max import capacity. The intraday power price in the SEM diverges significantly from GB in these instances, with spreads exceeding €100/MWh in many intervals.
Most interestingly, there is a distinct absence of data points in the lower left-hand quadrant of these scatter diagrams. The few data points here represent intervals when the SEM is both cheaper than GB and exports are occurring. This area of the chart is so sparsely populated that the axis scale is asymmetric, barely any negative price spread values occur in the dataset.
I would love to hear some explanations or insights from power traders or other market experts on these trends, specifically:
Why does price formation in the SEM intraday auctions so rarely drive prices below those in GB, even during periods of excess wind and curtailment?
I presume the answer might just be structural. GB has abundant interconnection to continental Europe (8+ GW), nuclear baseload, a non-trivial quantity of solar and BESS capacity, and a large offshore wind fleet. Ireland currently lacks many of these things. This level of interconnection typically puts a pretty strong cap on how high power prices can get in GB.
What does this mean for the Celtic Interconnector?
A lingering question I have stemming from this analysis is:
What will happen to these market dynamics once the Celtic Interconnector comes online in 2028?
On first estimation, I don’t see why the market dynamics would be fundamentally different. France generally has even lower power prices than GB, and exports significant volumes of power across Europe each year as a result. France also has a much higher occurrence of negative pricing periods than Ireland, recording 513 negative-price hours in 2025, up sharply from previous years.
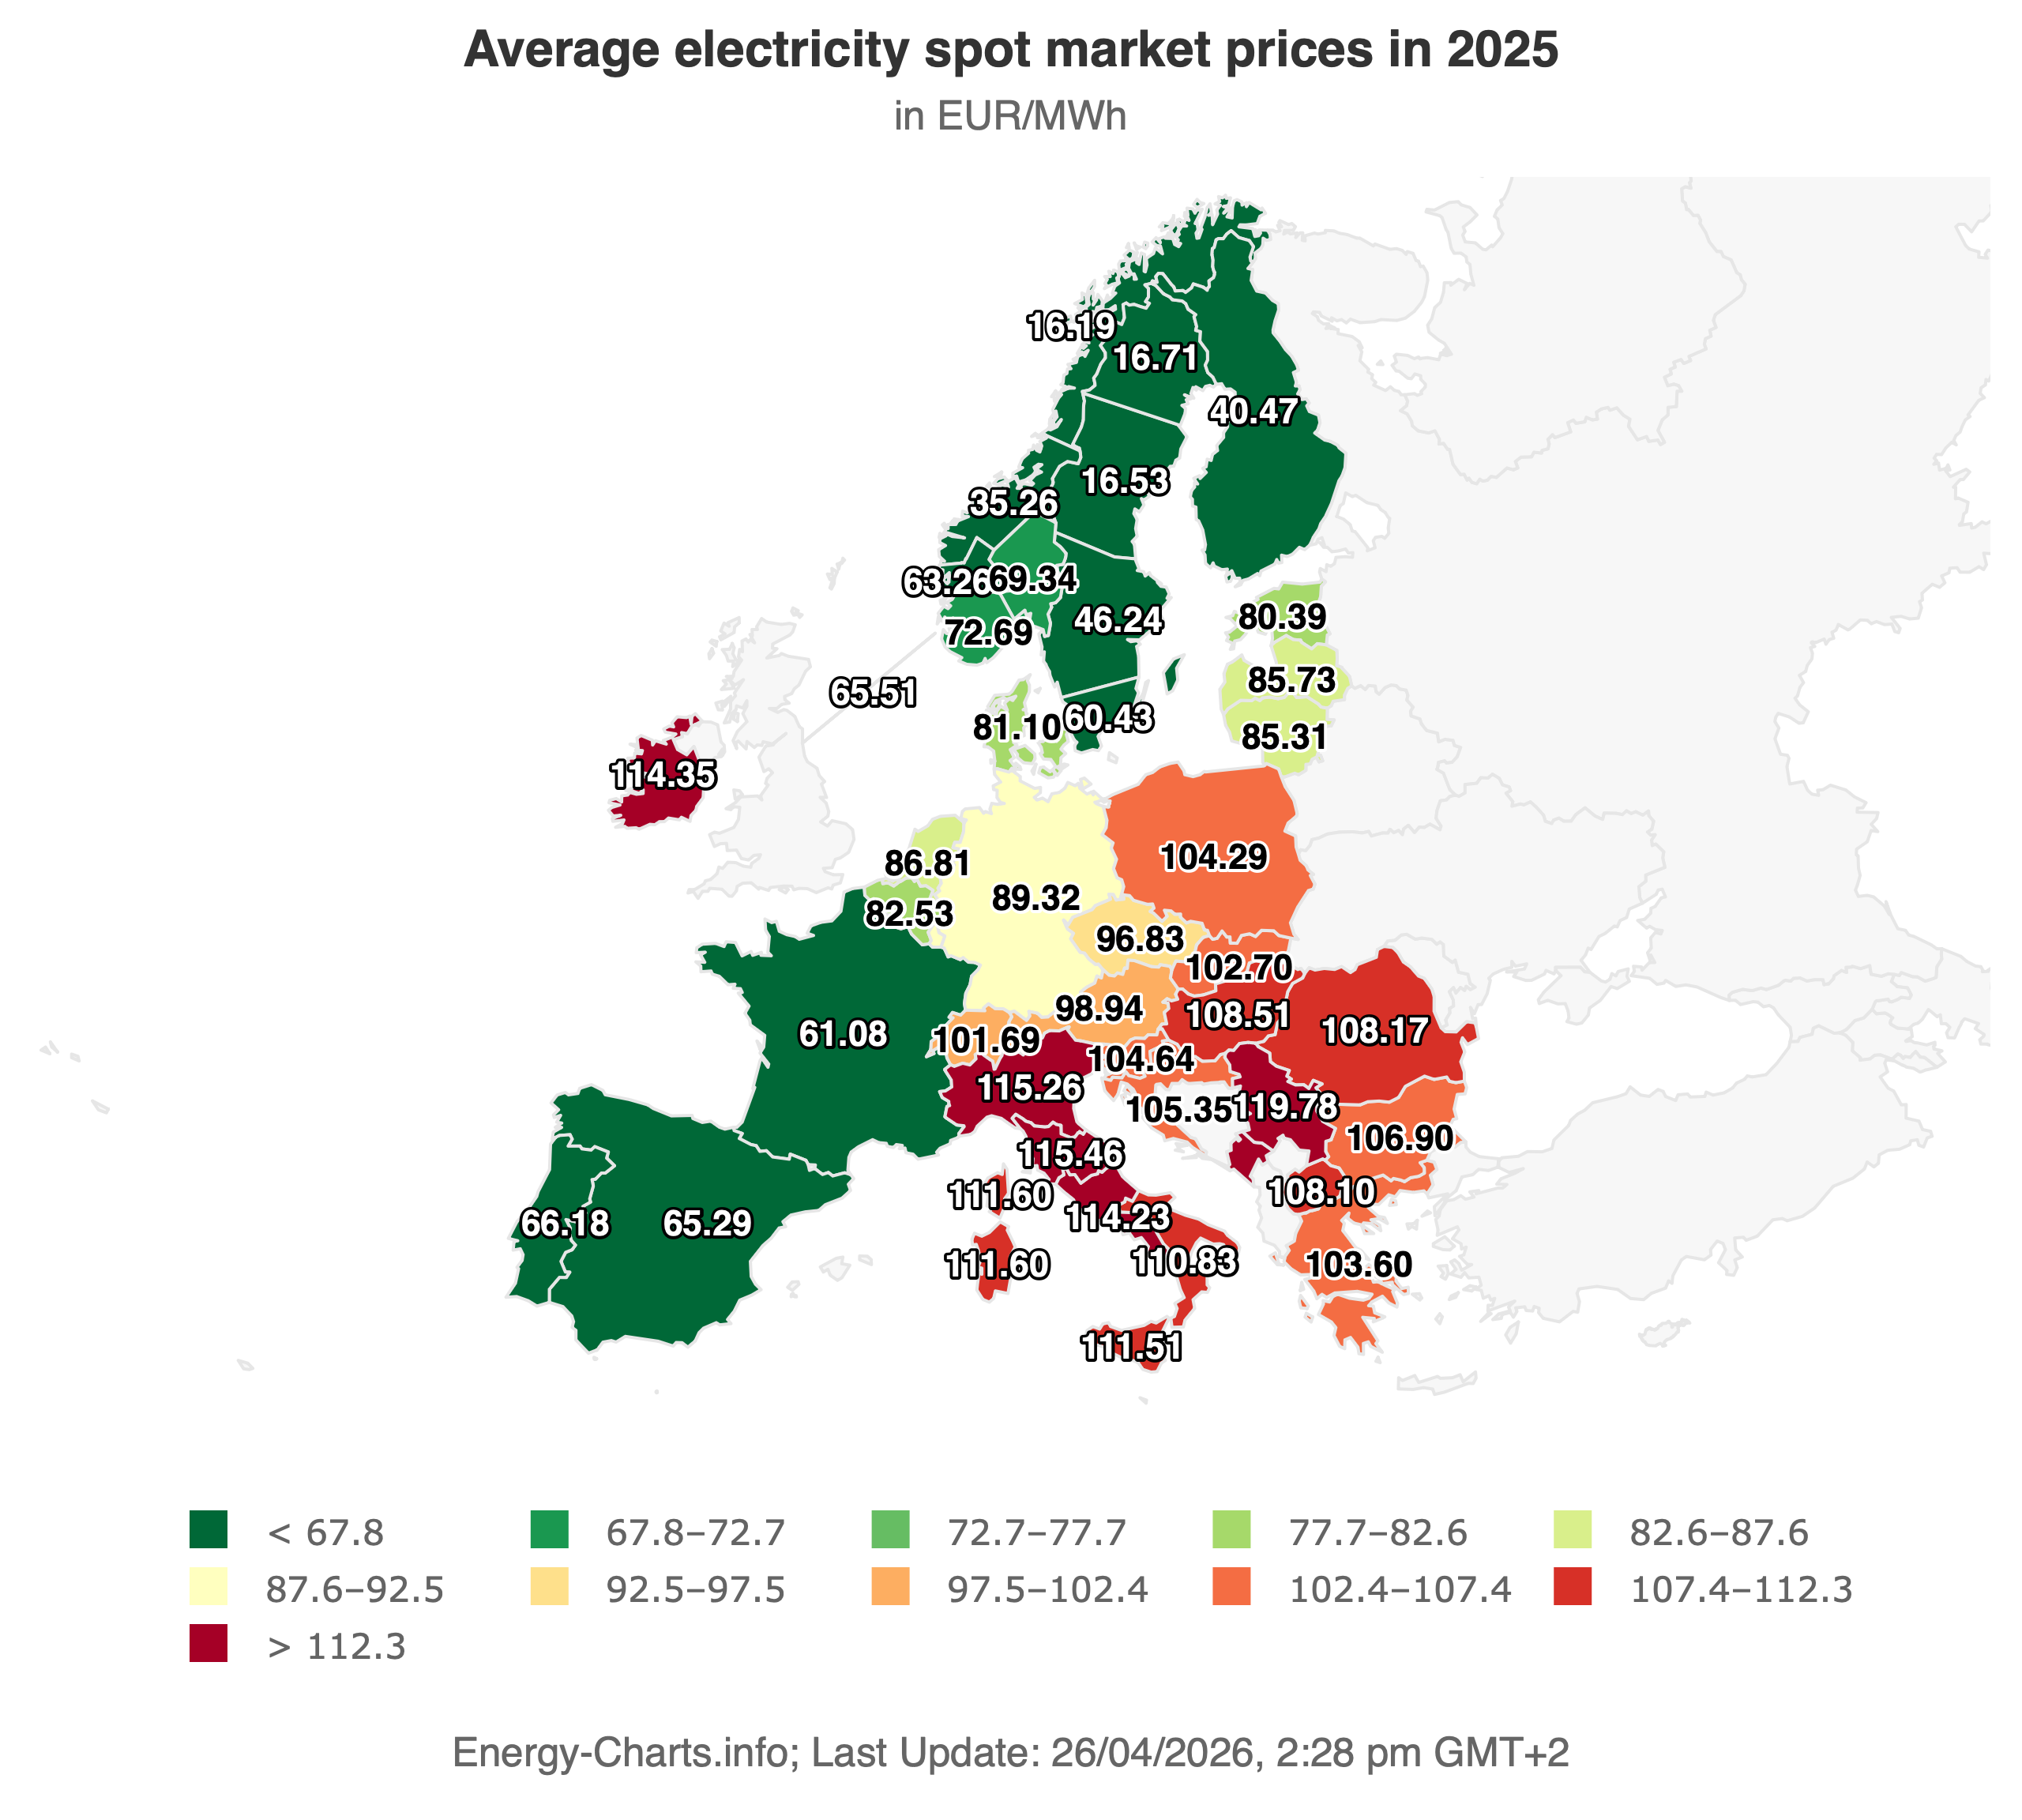
The average electricity spot price in France is significantly lower than in Ireland. In fact, prices are about half those experienced in the Irish market (see 2025 map below). And in the context of a potential future interconnector to Spain, its power market similarly experiences very low average wholesale prices when compared to the SEM.
One nuance relating to the Celtic Interconnector is that the cable will create a new bidding zone border between the SEM and France. It has been confirmed that this new SEM-FR border will be added to the Core Capacity Calculation Region (CCR), with its flow-based capacity calculation methodology. This means Ireland will participate in day-ahead flow-based market coupling (DA FBMC) with the entire Core region (see map below).
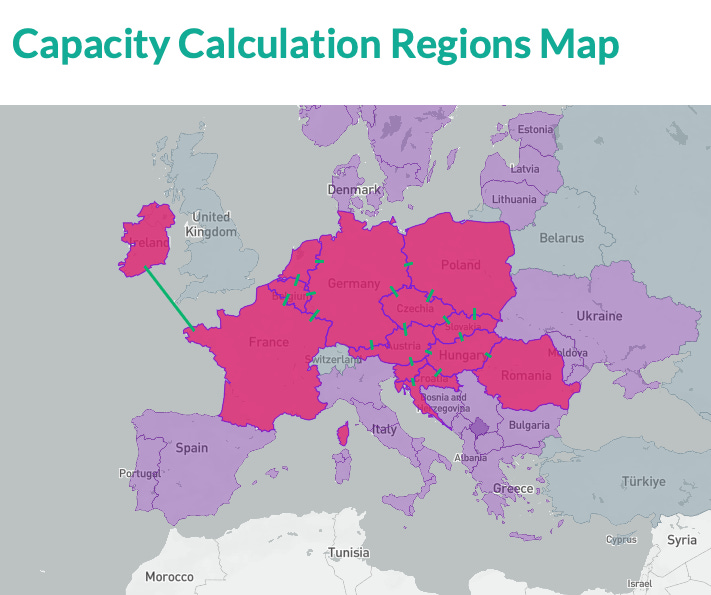
Ireland will be a small cog in this machine. The Core CCR currently comprises 13 countries with a total population of 278 million and estimated annual electricity use of 1,500 TWh. EirGrid and SONI are working on the ‘SEM Ex-Ante Market Design for EU Re-Integration’ and before the Celtic Interconnector goes live, they will need to ensure the SEM arrangements comply with EU regulations for Single Day-Ahead Coupling (SDAC), Single Intra-Day Coupling (SIDC), as well as Balancing Markets.
The flow-based process will determine the maximum capacity available on the Celtic Interconnector for cross-zonal exchange between the SEM and France. The capacity is calculated by taking into account the grid of the complete region and allocated implicitly by the market coupling algorithm by maximising the economic value of the energy exchanges. As power should automatically flow from lower-price zones to higher-price zones, the current import bias will likely persist.
I’d love to hear some thoughts on:
How will price formation in the SEM change once the Celtic Interconnector comes online, and what effect will this have on the trend of rising imports during periods when curtailment is active in the SEM?
Closing Thoughts
An obvious question here might be: what should be done about this?
I’m not entirely sure. It could be argued this is the market working exactly as (currently) designed. But I think a useful first step could simply be recognising that interconnectors are more complicated assets, or at least operate within more complicated power markets, than many people may have assumed.
Interconnectors are price-arbitrage assets operating in complex, coupled markets. They have no built-in preference for exporting Irish renewable energy. They follow price differentials, and the Irish price is shaped by more factors than just the level of wind generation on the system.
One possible solution that springs to mind when looking at the SNSP formula would be to incentivise the build-out of more BESS capacity in the SEM. This would provide a domestic sink for surplus renewable generation, one that isn’t dependent on the quirks of interconnector market coupling. However, this alone won’t be a large enough solution. Additionally, increasing the current 75% SNSP limit will be absolutely critical. This is a topic I might explore in a future article.
As always seems to be the case with the energy transition: it’s complicated, and it’s messy.
Methodology
Data was sourced from the EirGrid System and Renewable Data Reports, which publishes two relevant datasets: dispatch-down reports which include half-hourly wind and solar curtailment data, and historical 15-minute system data reports which includes HVDC interconnector flow data. Both datasets were downloaded for the period January 2023 to April 2026. 2022 data was excluded due to incomplete EWIC interconnector records in the available export.
The interconnector data was resampled from 15-minute to 30-minute resolution by averaging pairs of readings, bringing it to the same resolution as the curtailment data. Both datasets were then merged to produce 58,366 matched half-hour intervals.
Curtailment was defined as active in any half-hour where curtailed energy exceeded zero MWh. Interconnector flows follow the EirGrid System and Renewable Data Reports sign convention: positive values indicate imports from Great Britain to Ireland, negative values indicate exports from Ireland to Great Britain. The net interconnector flow for each half-hour was calculated as the sum of EWIC, Moyle, and Greenlink flows. Greenlink data was treated as zero prior to 29 January 2025, its first date of commercial operation.
All data processing, analysis, and chart production was carried out in Python using pandas and matplotlib. The EirGrid Data is publicly accessible and the full dataset can be downloaded directly from their website.
Nice bit of analysis Cillian. A further contributing factor in 2026 is the new operational measure implemented by EirGrid to mitigate risk posed by data centre connections not being able to fault ride through at present. Have a look at this paper:
https://cms.eirgrid.ie/sites/default/files/publications/MPID345-Large-Demand-Facility-Fault-Ride-Through-Issue-and-Proposed-Solutions-EirGrid-and-SONI-Information-Paper-November-2025.pdf
"Implementation of Operational Measures to reduce the magnitude of the potential imbalance and the resulting impact of an imbalance. Measures already implemented include placing limits on HVDC Interconnector exports"
You can see this filter through to EirGrid's weekly Operational Constraints update here (see page 9):
https://www.sem-o.com/sites/semo/files/2026-05/Wk22_2026_Weekly_Operational_Constraints_Update.pdf
Alot of figuring out to do here and interconnectors are complicated beasts! Keep up the good work!
Thanks for the great analysis.
I think one thing that will be different about the Celtic interconnector is that the British and Irish markets are more correlated: good wind in Ireland is likely to be good wind in Britain. The French and Irish markets are less correlated, which might lead to more opportunities where wind power in Ireland can be exported to a market that isn’t experiencing the same wind.